The first time we shipped an AI car visualizer for a brand, the project took nine months. The most recent one took twenty-six days. Most of what changed is operational, not technical.
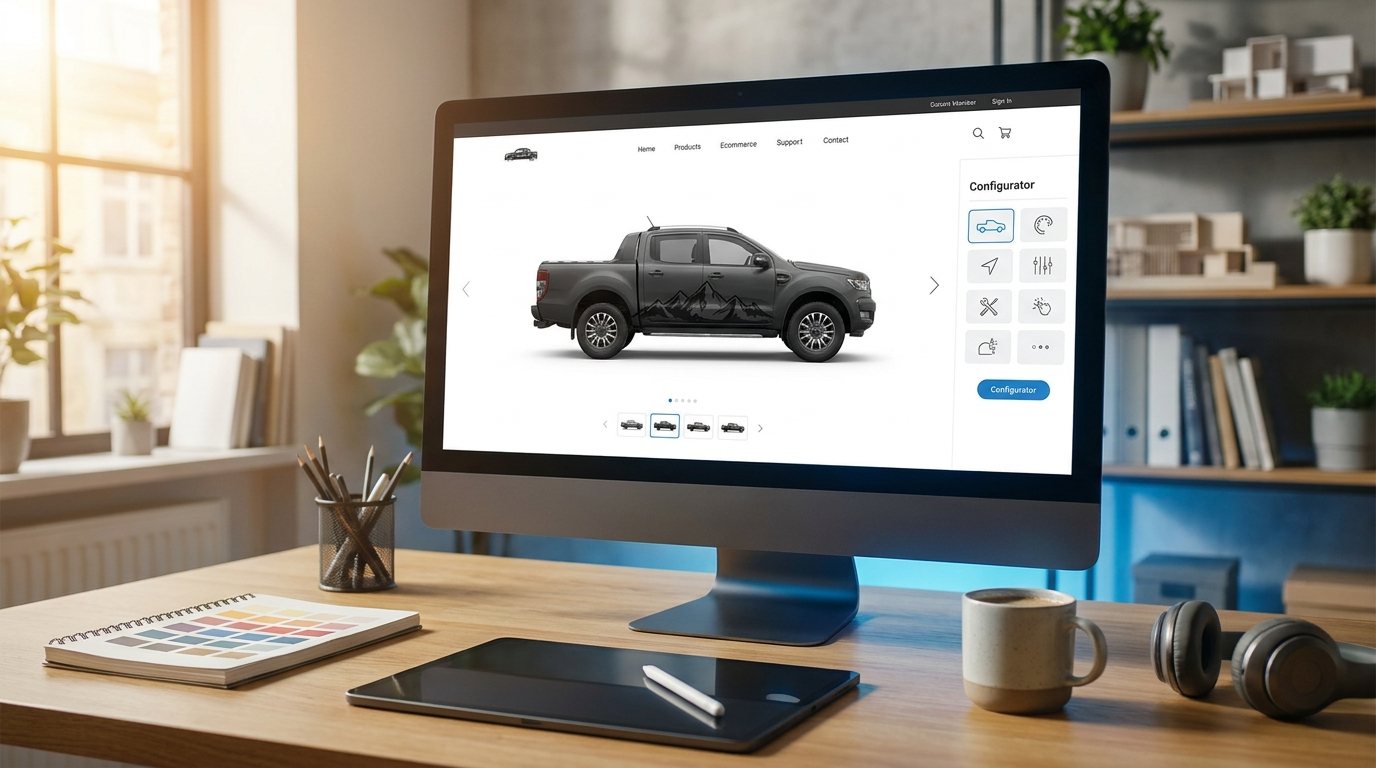
If you're scoping one of these projects right now, the rough shape below is what works. An AI car visualizer, briefly, is a piece of software that lets a shopper upload a photo of their car and see your product on it before they buy. The technical lift to ship one has gotten dramatically smaller. The team-coordination lift hasn't.
The four-week shape
Every successful rollout we've seen follows the same arc:
- Week 1, scope and integration plan. No code yet, just decisions.
- Week 2, brand integration and catalog prep. Skin the visualizer, load the product catalog.
- Week 3, embed and test. Drop the widget into the site, run internal QA.
- Week 4, beta and launch. Soft-launch to a subset of traffic, then full launch.
The teams that miss this timeline usually miss it for the same three reasons (covered at the end of this post). The teams that hit it tend to have one product owner with real decision authority and a vendor partner that ships fast.
The four-week plan only works if someone owns it end-to-end. Don't start without that person identified.
Week 1: scope and integration
Day 1-2: scope the embed
Sit with the team that owns your website and answer:
- Where on the site does the visualizer live? Product detail page? Standalone /visualize URL? Both?
- Is it gated behind email signup, or open to all visitors?
- Does it write back to your CRM (customer relationship management system), or just produce a visual?
- Does it work on mobile? (Answer: yes, mobile is now 60-70% of traffic.)
Don't try to scope every feature. Pick a launch surface, defer the rest to v2.
Day 3-4: pick the integration shape
Three options, in order of complexity:
- iframe embed (simplest). A line of HTML on your page loads the visualizer hosted by the vendor. Day-one deployable. The vendor owns hosting, performance, updates.
- JavaScript widget (mid). A script tag plus configuration. More control over styling and event hooks. Common for brand integrations.
- API integration (deepest). Your team builds the UI; the vendor exposes the rendering engine through an API. Most control, longest build.
For a 30-day timeline, iframe or JavaScript widget. API is a 12+ week project.
Day 5: confirm vendor selection
If you haven't picked a vendor yet, this is the week to commit. Look at configurator cost breakdown for the price bands. Most brand-grade embeds run $300-1,500/month all-in.
Spec the embed in week one. Build it in weeks two and three. Don't let scoping slide past Friday of week one.
Week 2: brand integration and catalog
Day 6-8: brand skinning
Your visualizer should look like part of your site, not part of the vendor's site. Send the vendor:
- Brand color palette (primary, secondary, accents)
- Typography (web font files or Google Font names)
- Button styles (border radius, hover states, primary CTA color)
- Spacing scale and grid alignment
- Logo files in SVG (for any in-tool branding)
A good vendor turns this around in 2-3 days. A great one has a self-serve theme editor so you can iterate yourself.
Day 9-11: product catalog prep
The visualizer needs to know what products to show. For each:
- Product name and SKU (stock-keeping unit, your internal product code)
- Product images (the vendor uses these for thumbnails)
- Material/finish data (color codes, texture maps, etc.)
- Price (if you want it visible)
- Inventory status (if you want sold-out products hidden)
This is where most timelines slip. Brands underestimate how out-of-date their product data is until they have to feed it to a third-party tool. Start this on day 6, not day 11.
Day 12: vehicle library validation
Your visualizer comes with a stock vehicle library (typically 500-1500 vehicles). Confirm coverage on the vehicles your target customers actually drive. If your typical buyer drives a Lifted RAM, make sure the visualizer has the Lifted RAM, not just the base.
Any gaps get added in week 3.
Bad catalog data ships a bad product. Spend the time in week two to ship a great product in week four.
Week 3: embed and test
Day 13-15: development integration
Your dev team drops the iframe or widget into the page. Wires up:
- Analytics tracking (Google Analytics, your usual stack)
- CRM hooks (if the visualizer captures emails or builds, those should flow into your CRM)
- Cart integration (if applicable, “add this build to cart” should work)
- Responsive behavior on mobile, tablet, desktop
Day 16-18: internal QA
The whole team uses the visualizer like a customer would. The non-technical people are your real QA, they catch the things engineers miss (“the colors look weird on my phone,” “the load time is annoying,” “the share button doesn't make sense”).
File issues. The vendor fixes them. Repeat.
Day 19: stakeholder review
Show it to whoever needs to sign off. CMO, brand lead, head of e-commerce. Get explicit approval before going to beta.
Internal QA is the difference between a smooth launch and a stressful one. Don't skip it to save three days.
Week 4: beta and launch
Day 20-23: beta to 10% of traffic
Most modern site stacks support A/B traffic splitting. Show the visualizer to 10% of visitors. Monitor:
- Performance impact (page-load time should not degrade by more than 100-200ms)
- Engagement (are users opening it? Are they finishing builds?)
- Errors (browser console errors, failed renders, broken interactions)
- Conversion (do users who use it convert at higher rates than control? They should.)
If the numbers look healthy by day 23, ramp to 50% on day 24. If they look great by day 26, ramp to 100% on day 27.
Day 28-30: full launch and post-launch comms
Email list, social channels, anywhere your audience pays attention. The launch is a real marketing moment, treat it like one.
Internal: brief sales, support, and dealer teams so they know what to say when customers mention it.
Soft launch buys you the safety net. Full launch buys you the marketing moment. Use both.
The three failure modes that blow the 30-day timeline
1. Scope creep in week one
Someone says “wouldn't it be cool if it also did X” on day three, scope balloons, week two slips, the rest cascades. The fix: scope freezes Friday of week one. Anything that comes up after gets a v2 ticket.
2. Catalog data that nobody owns
The product team thinks marketing owns the data. Marketing thinks engineering owns it. Engineering thinks the agency owns it. Days 6-11 turn into days 6-25.
The fix: name one person as data owner on day one. They have authority to make decisions about every field. They are not a committee.
3. Approval bottleneck at week three review
The CMO is traveling. The brand lead is in three meetings. The launch slips a week waiting for a 30-minute review.
The fix: book the approval slot on day one of the project, week three of the calendar. The meeting exists; people show up to it.
Most missed launch timelines aren't technical failures. They're calendar failures.
What week 5 looks like
After launch, the work shifts. Tracking conversion lift. Iterating on UX from real-user feedback. Expanding the catalog as new products ship. Adding the v2 features that got cut in scope freeze.
Brands that treat the launch as the finish line tend to see initial gains fade after 90 days. Brands that treat it as the start line keep the lift compounding.
If this is the project you're scoping right now, xix3D's AI car visualizer is built for this 30-day rollout shape. Custom-scoped programs at the OEM level are part of our Partner team's work. Either way, the playbook above works.
Four weeks is enough time. Most brands fail by spending it on the wrong things.